Permanent Magnet Synchronous Generator (PMSG) driven Wind Turbine..
Monthly Archives: January 2014
Permanent Magnet Synchronous Generator (PMSG) driven Wind Turbine.
INTRODUCTION
From all the generators that are used in wind turbines the PMSG’s have the highest advantages because they are stable and secure during normal operation and they do not need an additional DC supply for the excitation circuit (winding). Initially used only for small and medium powers the PMSG’s are now used also for higher power generation. Variable speed operation of modern wind turbine enables an optimization of the performance, reduces the mechanical loading, and at the same time delivers various options for active power plant control. Megawatt class wind turbines equipped with a permanent magnet synchronous generator (PMSG) have been
announced by Siemens Power Generation and GE Energy. In PMSG, the excitation is provided by permanent magnets instead of field windings. Permanent magnets machines are characterized as having large air gaps, which reduce flux linkage even in machines with multi-magnetic poles. As a result, low rotational speed generators can be manufactured in relatively small sizes with respect to their power ratings. Moreover, a gearbox can be omitted due to the low rotational speed in PMSG wind generators resulting in low cost.
WIND TURBINE DRIVEN GENERATORS
There are three main types of wind turbines currently in use: the fixed speed wind turbine with Squirrel Cage Induction Generator (IG), the variable speed wind turbine with Doubly Fed Induction Generator (DFIG), and the variable speed wind turbine with Permanent Magnet Synchronous Generator (PMSG).
1) Fixed Speed Squirrel Cage Induction Generator
This generator consumes reactive power and cannot contribute to voltage control. For this reason, although static capacitor control may allow wind farms with this type of generators are doomed to disappear from wind turbines.
 Figure 1: Induction Generator Schematic Diagram
2) Variable Speed Wind Turbine with Doubly Fed Induction Generator (DFIG)
This generator can be controlled to provide frequency and voltage control with a back-to-back converter in the rotor. This type of generator presents some difficulties to ride-through voltage dips, because voltage dip generate high voltages and currents in the rotor circuit and the power converter could be damaged. This is the most extended variable speed wind turbine technology and manufacturers already offer this type of wind turbines with fault ride-through capabilities.

Figure 2: DFIG Schematic Diagram
3) Variable Speed Wind Turbine with Permanent Magnet Synchronous Generator
This generator is connected through a back-to-back converter to the grid. This provides maximum flexibility, enabling full real and reactive power control and fault ride-through capability during voltage dips.

Figure 3: PMSG Schematic Diagram
WIND TURBINE CONCEPTS
The influence of wind turbine generators (WTGs) on power system dynamic performance is becoming increasingly important as wind generation grows.

Figure 4: Block Diagram depicting general structure of wind turbine
The aerodynamic model converts wind speed into the turbine mechanical torque and feed it into the drive train model. Input mechanical torque which is dependent to the wind speed should not exceeded the rated torque. Therefore, it must be limited. This can be done, for instance, with a pitch control ( β ). However in this work mechanical torque is considered constant and it is not speed dependent. The pitch angle is considered constant as well. Using the generator electro-dynamical torque and the turbine mechanical torque as inputs, the drive train model calculates the generator rotor speed. The induction generator takes bus voltage where the generator connected. Subsequently the output of the generator is fed into the grid.
MODELING IN MATLAB
The methodology adopted for the implementation of this project is shown in block diagram given below:

Figure 5: Block Diagram for PMSG driven wind turbine

Figure 6: Simulink Model for PMSG driven wind turbine in MATLAB
SIMULATION RESULTS

Figure 7: Three phase voltage at the terminals of generator

Figure 8: Line Voltage, Line Current, RMS Voltage, RMS Current, Output Power, Rotor Speed

Figure 9: wind speed [a], mechanical power [b], output electrical power [c] at variable wind speed of 3m/s, 6m/s, 9m/s, 12m/s, 15m/s.
For any queries contact,
ANAND MANDAL
anandkalyaneee@gmail.com
Filed under Uncategorized
LOAD FLOW ANALYSIS OF IEEE 30 BUS SYSTEM
INTRODUCTION
Power flow analysis is the backbone of power system analysis and design. They are necessary for planning, operation, economic scheduling and exchange of power between utilities. The principal information of power flow analysis is to find the magnitude and phase angle of voltage at each bus and the real and reactive power flowing in each transmission lines. Power flow analysis is an importance tool involving numerical analysis applied to a power system. In this analysis, iterative techniques are used due to there no known analytical method to solve the problem. To finish this analysis there are methods of mathematical calculations which consist
plenty of step depend on the size of system. This process is difficult and takes a lot of times to perform by hand. Load flow studies are used to ensure that electrical power transfer from generators to consumers through the grid system is stable, reliable and economic. Conventional techniques for solving the load flow problem are iterative, using the Newton-Raphson or the Gauss-Seidel methods. Load flow analysis forms an essential prerequisite for power system studies. Considerable research has already been carried out in the development of computer programs for load flow analysis of large power systems. However, these general purpose programs may encounter convergence difficulties when a radial distribution system with a large number of buses is to be solved and, hence, development of a special program for radial distribution studies becomes necessary. There are many solution techniques for load flow analysis. The load flow analysis for this project is done through MATLAB programming. The objectives of this project work is run a load flow for IEEE 30 bus system and analyze the impact of several parameters upon the performance of line and suggest alternatives in order to improve the performance of line.
POWER FLOW OVERVIEW
The main aim of this project work is to concentrate on the load flow analysis of IEEE 30 bus system. However, the other objectives that also come under play and needs to be considered are as follows:
i. Power flow analysis is very important in planning stages of new networks or addition to existing ones like adding new generator sites, meeting increase load demand and locating new transmission sites.
ii. The load flow solution gives the nodal voltages and phase angles and hence the power injection at all the buses and power flows through interconnecting power channels.
iii. It determines the voltage of the buses. The voltage level at the certain buses must be kept within the closed tolerances.
iv. The line flows can be known. The line should not be overloaded, it means, we should not operate the close to their stability or thermal limits.
v. To study the performance of the transmission lines, transformer and generator at steady state condition.
BUS CLASSIFICATION
A bus is a node at which one or many lines, one or many loads and generators are connected. In a power system each node or bus is associated with 4 quantities, such as magnitude of voltage, phage angle of voltage, active or true power and reactive power in load flow problem two out of these 4 quantities are specified and remaining 2 are required to be determined through the solution of equation. Depending on the quantities that have been specified, the buses are classified into 3 categories. For load flow studies it is assumed that the loads are constant and they are defined by their real and reactive power consumption. The main objective of the load flow is to find the voltage magnitude of each bus and its angle when the powers generated and loads are pre-specified. To facilitate this we classify the different buses of the power system shown in the chart below.

Figure 1: Classification of Bus
IEEE 30 – BUS TEST SYSTEM
In Power System Engineering, the load flow study (also known as power flow study) is an important tool involving numerical analysis applied to a power system. Unlike traditional circuit analysis , a power flow study uses simplified notation such as a one line diagram and per unit system , and focuses on various forms of AC power (i.e. reactive ,real and apparent ) rather than voltage and current. It analyses the power systems in normal steady state operation. There exist a number of software implementations of power flow studies. This project uses the MATLAB programming for load flow study.

Figure 2: One-line diagram of IEEE 30 bus test system
LOAD FLOW SOLUTION
1) Gauss-Seidel Method:

Figure 3: Y Sparse Symmetric matrix from Gauss-Seidel method

Figure 4: 3D and 2D visualization of bus voltage magnitude
2) Newton-Raphson Method:

Figure 5: 2D visualization of bus voltage magnitude
3) P-Q Decoupling Method

Figure 6: 2D visualization of bus voltage magnitude
CONVERGENCE
From, the above load flow solution it was visualized that NR method converges fast than other method of load flow solution

Figure 7: Convergence curve for gauss seidel(left) and newton-raphson(right)
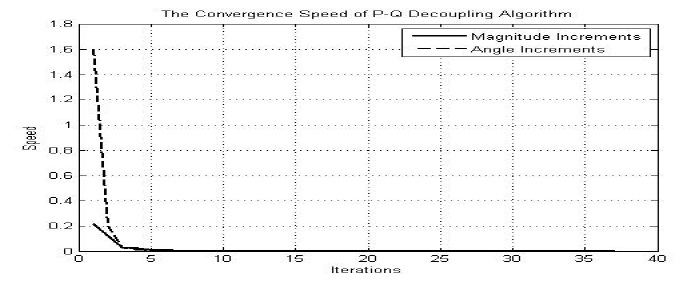
Figure 8: Convergence curve for PQ Decoupling Method.
For any queries contact,
ANAND MANDAL
anandkalyaneee@gmail.com
Filed under Uncategorized
