Category Archives: Uncategorized

Basics of Power System Post Fault Analysis using COMTRADE file

Electrical Power System compromises of several equipment’s which are used according to the specified purpose serving different objectives in power system. Generally, power system is classified and clustered under the broad scope of generation, transmission and distribution. There are several equipment’s used for different purpose serving specified objectives in power system and such equipment’s are prone to different types of fault in their operation. In order to operate the power system smoothly, different types of protection are engaged to cope with different types of fault. But sometimes due to different reasons, the failure of protection may hamper the equipment operation and sometimes may damage the equipment as a whole. Thus, analysis of fault is very important to tackle such situations in future ensuring healthy and smooth operation of power system. In earlier days, post fault analysis was complicated since majority of protection relays was of electromagnetic type but in recent days with use of digital relays the fault analysis has became quite easier tough continuous monitoring and analysis is required.

Digital electronic relay has capability to store disturbance record (DR) within the relay which can be downloaded as COMTRADE files for better analysis. COMTRADE (Common format for Transient Data Exchange for power systems) is a file format for storing oscillography and status data related to transient power system disturbances. COMTRADE files are typically generated by Intelligent Electronic Devices (IEDs), such as an electronic protective relay, in electrical substations during power systems disturbances. These IEDs are monitoring the electrical characteristics of the power system by digitally sampling measurements of the current, voltage, power, frequency, etc. at a high speed. The COMTRADE file format has been standardized by the Power System Relaying & Controls Committee (PSRC) of the IEEE Power & Energy Society as C37.111. The most widely used version of the COMTRADE standard is C37.111-1999, but the latest version is C37.111-2014. The 1999 version of the COMTRADE standard specifies a file format that consists of multiple file types designated by the assigned file extensions of *.CFG, *.INF, *.HDR, and *.DAT. The 2014 version of the COMTRADE standard supports a variety of new features including XML encoding configuration and data, a single file type (*.CFF) that combines all the C37.111-1999 types into a single file.

In this blog, I will discuss the procedure to download DR from IEDs and will present fault analysis for fault occurrence in Power Transformer. For the analysis purpose in this blog, I shall be considering relay built by ABB such as relay model no: RET 650 for analysis of fault in transformer.

  1. Steps to download Disturbance Report

Every protection relay (IEDs) has their own connectivity package and software via which relay is connected with PC to fulfill different purpose. Settings, Configuration, Tripping Logic, SLD could be set in relay via this connection and at the same time disturbance report could also be downloaded. For this, you need to have PCM 600 software installed in PC and connectivity package of relay on which you are willing to work.

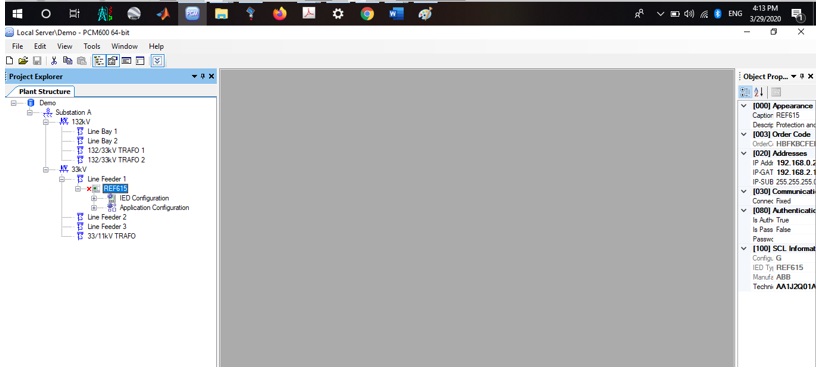
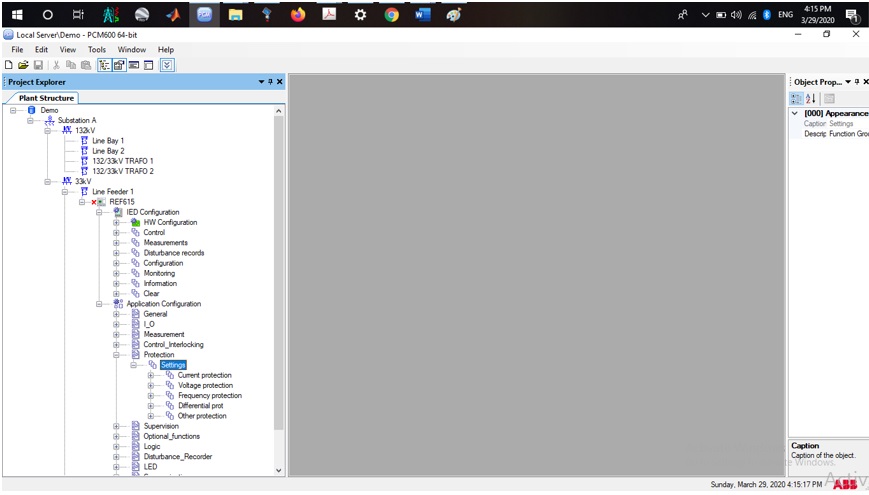
  • Open the PCM 600 in your PC and also install connectivity package of relay from which you are willing to read or write data. For ex: RET 650 connectivity packages for transformer protection.
  • Create a project in PCM 600 as displayed below and add necessary relays installed in line or transformer feeder. Once the relay is connected with PC, the blue tick sign appears on right side of relays.
  • Right click on your selected relay and select disturbance handling from which you need to download DR.
  • A list of DR appears as shown below:

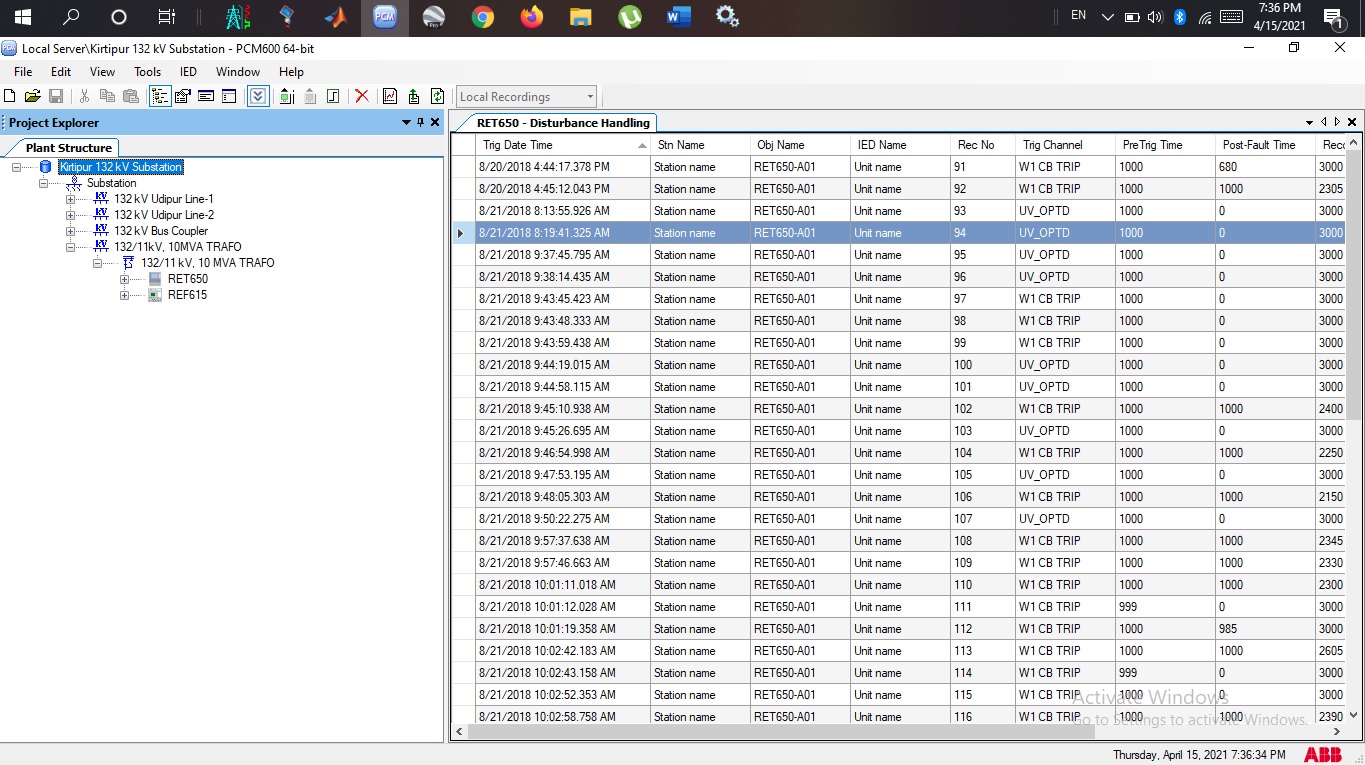
Fig 1: List of DR obtained for RET 650
  • Now you need to select all DR and right select to read recording from IED. After that you can export recordings to your desired folder for analysis. But in order to download DR recordings you need to be sure that your IED is online, i.e., it must be connected to PC.

I hope the process described above will let you to download the disturbance record easily from your IEDs for fault analysis.

  1. Power Transformer Fault Analysis

In order to analyze the fault, you must be sure about the tripping logic for which specific protection feature is intended to operate. Also, it would be better if you are aware about the control wiring for which the tripping logic is set to operate otherwise the maloperation of relay may occurs pointing towards out of the zone protection. For Ex:

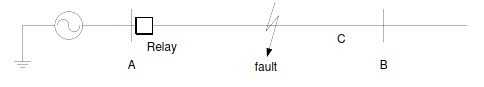
Fig 2: Illustration for out of the zone protection

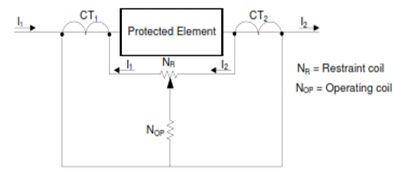
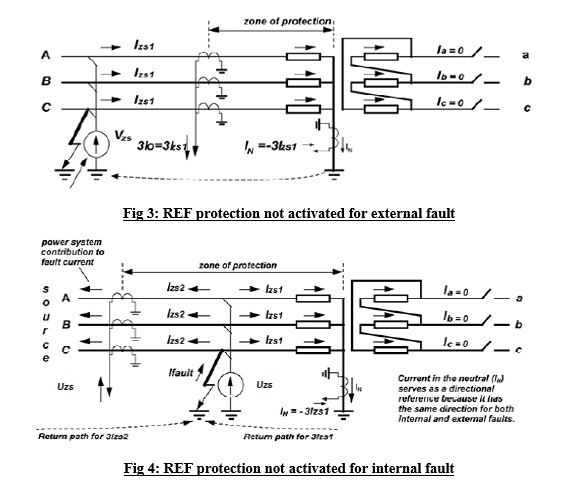
In above figure, wye-wye-delta connected transformer the differential protection is meant to be operated for Y-Y winding. The star point of bushing CTs as shown is pointed towards transformer winding which is very important because star point directed towards opposite of winding may lead to out of the zone protection and transformer may operate due to external fault which is not the objective of differential protection. If bushing CT star point is made towards transformer winding then residual current (Ires) 3Io cancels neutral current (In) whereas otherwise 3Io and In became approximately in phase for internal ground fault leading to trip the transformer in internal fault only. Refer to Figure 3 and Figure 4 for better illustration.

Now, let us consider the Restricted Earth Fault Protection (REF, 87N) occurrence in power transformer and factor responsible for tripping of transformer in REF. REF is considered in this blog since it is often less prioritized which may hamper the transformer in long run since occurrence of this type of fault is due to the internal problem. The analysis of REF fault in this blog is considered such that low impedance differential protection is adopted in power transformer since majority of power transformer installed by Nepal Electricity Authority has adopted this protection philosophy.

Tripping Logic for REF protection

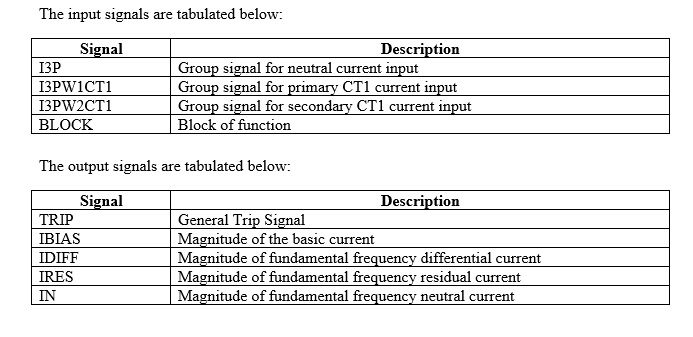
The power transformer considered under this blog in Y-Y connected thus REF protection must be adopted for both HV and LV winding, the logic of which has been given below. The tripping logic could be customized according to your protection requirement but we must be sure that it ensures the healthy protection system.

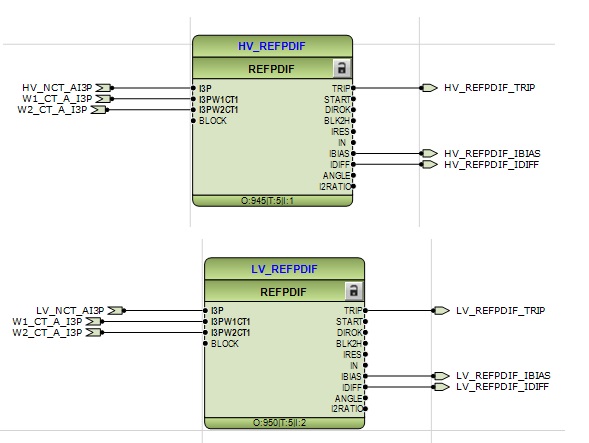
Fig 5: Tripping Logic for REF protection

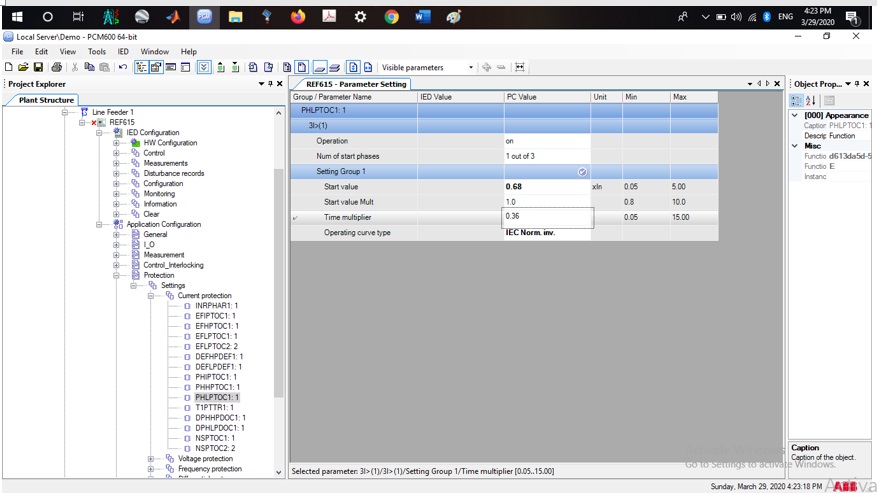
There is different tripping logic for each individual protection which could be observed in Application Configuration in PCM 600 for each relay and could be customized according to requirement.

Fault Analysis using COMTRADE

The oscillatory waveform and phasor diagram of downloaded DR could be analyzed from other software capable of opening such files such as Wave win. Let us open one DR obtained due to tripping of power transformer in REF to have the basic understanding of DR for fault analysis.

Fig 6: Comtrade file view of HVREF fault in transformer

The above DR is of power transformer tripping in HVREF fault. The red dotted vertical line indicates the waveform at instant of fault whereas black dotted vertical line could be scrolled ac per our requirement to see the waveform details and values at any instant. The fault magnitude or magnitude at any instant could be read from right window beside waveform. The phasor diagram of each channel could be observed in right most window. We could observe during the occurrence of fault the waveform is abnormal. Since we are concerned with REF protection, we need to concentrate on the particular channel signal responsible for tripping of particular protection. The input and output signal for particular protection could be known from tripping logic and for better analysis only those signals could be analyzed by omitting the unwanted signal waveform for better analysis. For REF protection let us concentrate on the channel responsible as indicated in tripping logic. The transformer considered in this case in 132/3kV, 30MVA where full load current on HV and LV side is 131.21 A and 524.87 A respectively. The REF protection is set as 10% of full load current such that current exceeding 13.12A on HV and 52.48A on LV side trips TRAFO in HVREF and LVREF respectively.

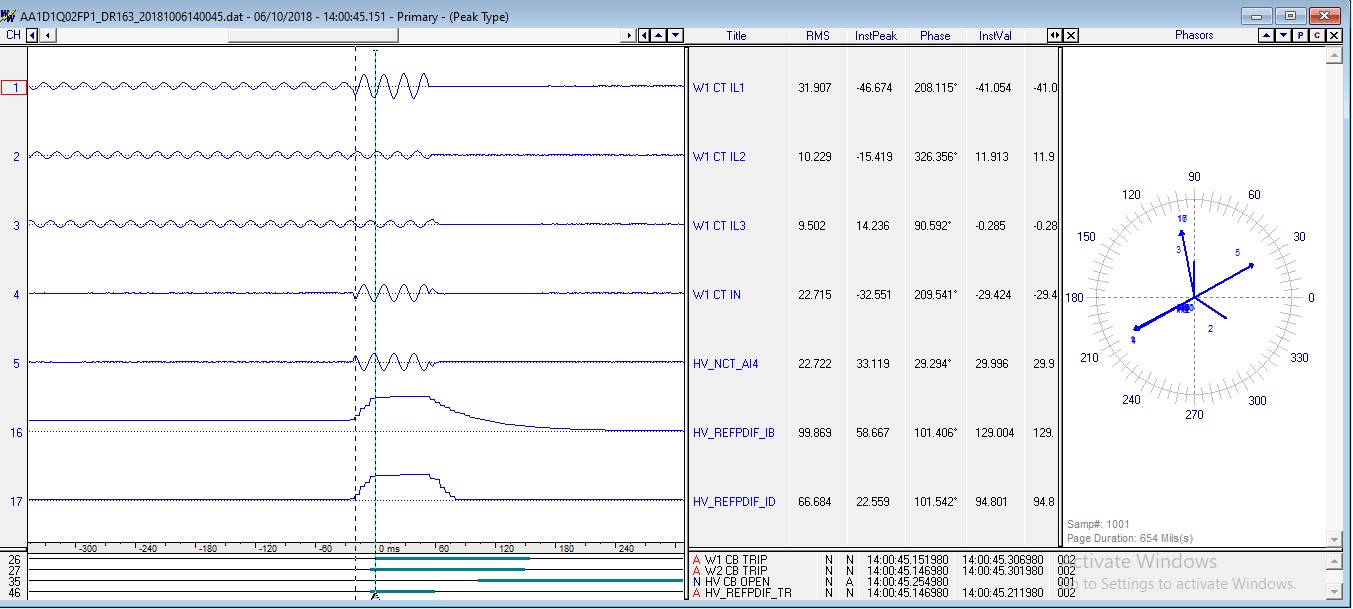
In above figure all other irrelevant channel waveforms are omitted for better view of selected waveform. We could observe prior to fault all waveform is in normal shape with normal magnitude according to load current but at instant of fault waveform became abnormal. We could see fault was triggered from R phase HV bushing CT where its RMS value recorded was 31.90A whereas RMS current of Y and B phase was 10.22A and 9.50A respectively. This abnormality in R phase of HV leads to magnitude of neutral bushing CT of HV as 22.71A leading to differential current of 66.68A tripping the TRAFO in HVREF since it exceeds the set value of 13.12 A. It gives a better indication that fault was triggered from R phase thus post fault we must concentrate on the reasons why R phase triggers the fault. The reason might be due to wiring mismatch of CT core of that particular bushing, incorrect star point leading to maloperation of relays or in extreme cases it might due to failure of R phase winding on HV side. Particularly, in this case there was maloperation of relay due to wiring mismatch leading to incorrect star point on HV side.

Another way to see the healthiness of protection without any software is to scrolling the keys of relay and observe the display. For REF protection, go to differential function status of relay and enter the REF mode. There are several readings displayed there in real time such as Idiff, Ibias, Ires, In etc. If during the normal operation Ires and In are subtractive then your protection is healthy since during the fault only Ires and In becomes additive. If Ires and In are additive during normal operation then you must trace out the wiring from bushing CT to TRAFO Marshalling Box to Relay Panel TBs to Relay TB to sort out the issue.

I hope this blog to some extent helps about the protection features and basics of fault analysis but extensive analysis depends upon your interest and alignment with use of software and also with input and output signals responsible for particular protection adopted. I shall be discussing about the faults in transmission line and its analysis in next blog.

Leave a comment

Filed under Uncategorized

Protection Relay Settings ensuring effective coordination and familiarization with ABB relays

Introduction

Protection relay settings in power system plays a very vital role for safe operation of power system ensuring minimal outage to end user thereby contributing to less loss in terms of financial matters to utility as well. In other words, protective relay in any components of power system are backbone of system, the failure or maloperation may lead to undesired or nuisance tripping causing failure of equipment’s at local end as well as remote end effecting large number of consumers.

Modern day power system operates as a whole thus effective coordination between relays at local and remote end ensures power system reliability, quality, stability ensuring healthy operation of power system which is beneficial to both utility and consumers. The non-effective coordination may lead the fault to migrate from effected to non-effected zone thereby collapsing the entire power system. The all relays in power system has their own actuating quantity on the basis of which desired protection objectives is fulfilled, but it must be made sure that any part of the system must not be left unprotected.

In this blog, I will basically be dealing with settings of earth fault and overcurrent relay which is one of the most happening faults in power system connected with end user, the earth fault being the most severe one. Also, the coordination example will be illustrated for earth fault and over current protection since beside this in other protection coordination sequence is often less required.

Parameters for Relay Setting

O/C and E/F relays are those relays that respond to current only. The relay will operate if the current passing through the operating coil are higher than the threshold current. The threshold current is the set current below which the relays must not operate and above which they should operate. Basically, overcurrent relay is a type of protective relay which operates when the load current exceeds a preset value whereas earthfault relay operates having current threshold of 10-20% of load current. Depending upon the time of operations relays may be classified as:

Standard Inverse Definite Time Relay

These are relay whose operating time is approximately inversely proportional to fault current near pick up value and becomes substantially constant slightly above the pick-up value of the relay.

1 sir

Extremely Inverse Relay

This relays are used for the protection of transformer, cables and feeders because it is possible to achieve accurate discrimination with fuses and auto re-closures in their case.

2 eir

Very Inverse Relay

The time current characteristic is inverse over a greater range and after saturation tends to definite time. This type of relays are employed in feeders and long sub transmission lines.

3 vir

Settings of O/C and E/F relay

The relay setting for overcurrent and earth fault protection requires parameters such as load current (often assumed) depending upon the load consumption data recorded on log sheet during peak time which is to be supplied by particular feeder. The CT ratio in which the primary feeds the load and secondary feeds the relay. The required overcurrent and earth fault threshold, which is to be adopted according to utility standard of requirement. I have adopted 110% and 10% threshold for O/C and E/F settings. I have tried to show the simplest technique for protective relay setting, there are other techniques where fault current is employed which shall be shown in next blog.

Step 1: Assume Load Current (IL)

Step 2: Gather CT ratio (for ex: 200/1A, 400/1A, 800/1A etc.)

Step 3: Assume threshold for O/C and E/F protection

Step 4: Calculate Fault Current

For ex: If %Z of largest transformer connected at local end is 11%, then for fault current at 33kV voltage level is = IL/%Z = 4771.63 A (if transformer size is 30 MVA).

Step 5: Calculate Relay Plug Setting Multiplier

PSM = Fault Current/Actual Pickup

For Ex: If load current is assumed as 500A, then overload current = 500 x 1.1 = 550A.

Plug Setting for O/C = 550/800 = 0.68

Step 6: Calculating operating time of relay. Since normal or standard inverse time relay is adopted here, the time-delay is calculated from formula given above.

table

Relay Co-ordination

The basic of parameter calculation is same as explained above but the objective of coordination shall be such that fault at any place must be cleared by substation near it and should not migrate upstream or downstream. The correct application and setting of relays require a knowledge of the fault current at each part of the power system network. The following data are required for finding out the setting of the relay.

  1. A single line diagram of the power system.

2.The impedance of the transformers, feeders, in ohm or in PU.

3.The maximum peak load current in feeder and full load current of transformer.

4. Maximum and minimum short circuit current that are expected to flow.

5.Type and rating of the protective devices and transformer.

The time interval of operation between two adjacent relays depends upon a number of factors;

 The fault current interrupting time of the circuit breaker.

 The overshoot time of the relay

 Variation in measuring devices errors.

 Factors of safety.

coord

In above figure, relay co-ordination is achieved when fault F1 is cleared by relay R1 and also operating sequence of relay shall be in following manner: R4>R3>R2>R1.

Writing Setting Parameters to Relay

In this blog, setting the calculated parameters to relay has been shown. For this purpose, ABB relay has been adopted having model no: REF 615. This blog will only be informative and the detail explanation shall be explained in another blog for setting distance relays of line or transformer differential protection. The settings parameters to relay could be feed directly into relays manually with the help of buttons or by employing computer. Feeding parameters manually may be complex and tedious sometimes when large number of data are to be feeded, for ex: line protection, transformer protection. ABB requires PCM600 software to enable computer to access relays. In this blog, I will be only showing the step regarding setting of overcurrent relays.

Step 1: Gather LAN cable and Open PCM 600 software, connect one end to relay and another to your PC port.

Step 2: In order to connect relays optically, you must have connectivity package for that relay which is available freely. For ex: I must have REF 615 relay connectivity package in order to write into that relay.

Step 3: Create new project and make it according to your substation maintaining it in hierarchical order from higher voltage at top to lower at bottom.

Step 4: Add no. of feeders in each voltage level as it is required. For ex: I am concerned with one 33kV line Feeder. I will go to 33kV voltage level and add relays added to that feeder as shown in below figure.

fig 1

Step 5:  After addition of relays, go to application configuration, then to protection, then to settings and then to your desired protection as shown below:

fig 2

Step 6:  Since I am only dealing with overcurrent protection in this blog, thus for that we need to go for current protection and then to PHLPTOC1 which is ANSI code for low set over current first instance 1 overcurrent protection. Right click on that and go to parameter setting and enable protection and input your plug setting and operating time of relay.

fig 3

Step 7: After inputting all data and parameters click on ‘Write Parameters to IED’ available in top task bar of application.

This blog is very general to be familiar with protection settings and IED. The detail calculation of some complex protection schemes with IED shall be presented in my next blog.

-ANAND MANDAL


Leave a comment

Filed under Uncategorized

Basics and Setting of Parameters for Protection of Transmission Line

Transmission Line is one of the major components of electrical power system; commonly it can be related with highway of electrical energy from where energy is transferred from source to load. Since, overhead transmission line are directly exposed with outer atmosphere and it passes through different land profile with varying climate, protection of transmission line is one of the major concern for power system operators.  The failure of transmission line may lead to system instability ultimately resulting in system collapse, which is often seen and observed as headache for operators. In this blog, I will be discussing about the basics of transmission line protection and relay setting parameters required for protection of transmission line.

The protection of transmission line is broadly classified in two categories which are further classified according to protection requirements required by utility considering the sensitivity of transmission lines:

1) Main Protection

The main protection of transmission line is achieved by distance protection generally referred as 21 in device numbering. Distance relaying are considered since overcurrent relaying is too slow or is not selective. Distance relays are preferred to overcurrent reIays because they are not nearly so much affected by changes in short-circuit-current magnitude as overcurrent relays are, and, hence, are much less affected by changes in generating capacity and in system configuration.

2) Backup Protection

Directional overcurrent and earth fault are generally referred as backup protection referred as 67/67N in device numbering.

The protection of transmission line is done at substation where the particular lines are terminating. We have read lot about theory in books thus I am jumping directly towards the content starting with figure given below:

Figure 1 represents the single line diagram adopted for transmission line protection at double bus substation where LINE 1 is terminated. The protection associated with LINE 1 shall be employed at substation represented with double bus in given figure. Since we are only concerned with protection of transmission line, only short introduction regarding other protection shown in single line diagram will be given.

Fig 1 SLD

Figure 1: SLD of transmission line protection

It is very well known to us that input to relay for desired protection is given by CT which generally serves two purposes: metering and protection. Here, metering core is designated as core 2 with accuracy class of 0.2. Core 1, Core 3, Core 4 and Core 5 serves the purpose for protection where Core 1 is used as main protection, i.e. distance protection (21) whereas Core 3 serves for backup protection and Core 5 is employed as busbar differential protection. It’s better to employ PS accuracy class CT for protection since there are no issues regarding CT saturation.

According to basic protection philosophy, core towards bus shall be used for line protection and core towards line shall be used for bus protection to cover the entire protection zone between CT cores.

Setting Parameters for Main Protection (Distance Relay, 21)

  1. General Parameters

Before getting started with setting parameters, first of all required data needs to be gathered and accessed, calculated and then finally to be written in relay for proper functioning of desired protection. Figure 2 represents the general information regarding parameters at Substation A. The line considered in this blog is of 132 kV voltage level, however voltage level does not affects the setting procedures. Process is same for 220 kV, 400 kV, 765 kV and 1200 kV lines.

Figure 2 General

Figure 2: General Information of Parameters

The only complicated thing to be calculated is positive and zero sequence impedance of line which is major input for operation of distance relay. The properties of conductor, OPGW/earth wire and tower configuration is required for computation of sequence impedances. It can be calculated manually or with the help of software like MATLAB, Power World Simulator etc. or with impedance measurement equipment. Generally, I prefer to use Simulink of MATLAB with tool ‘Compute RLC line parameters’ for computation of sequence impedance. The graphical interpretation of protected line and adjoining line are shown in Figure 3.

Figure 3 GRaphical Line

Figure 3: Graphical Interpretation of protected line


2) Parameters for Line Protection

After done with the general parameters we need to calculate the positive sequence, zero sequence and mutual impedance of overall line length of protected line and every adjoining lines which has been shown in figure 4. Since, we are concerned with protection of single circuit line there is no zero sequence mutual impedance, only positive and zero sequence impedance are presented.

Figure 4 protected line

Figure 4: Parameters for protected line

Similarly, the parameters for line in reverse from local end and adjoining line from remote end are calculated in same way which has been given in figure 5.

Figure 5 adjoiining line

Figure 5: Parameters for adjoining lines

 3) Zone Reach Settings

The features of distance relay is that line is protected by dividing the line into different zones considering its length as well as length of adjoining lines from local and remote end. Generally, distance relay functions by separating into five (5) zones referred as zone 1, zone 2, zone 3, zone 4 and zone 5. The zone 4 and zone 5 are known as reverse zone whereas former three zones operate in forward region. The zone reach setting may vary according to grid code or standards of utility or country, but here I will be showing general setting criteria for respective zones as given below:

Zone 1:            80-85 % of protected line

Zone 2:            120 % of protected line

Zone 3:            120 % of protected line + 120 % of longest line from remote end

Zone 4:            20% of protected length

Zone 5:            not required here

The zone reach setting for distance relay alongwith operating time for respective zones has been shown in figure 6. The operating time may be adjusted as according to requirements or standards set by regulator/utility/country.

Figure 6 reach setting

Figure 6: Zone Reach Setting for Distance Relay

After calculating the zone reach setting, you need to input this data into relay in their format which may be different for every manufacturer like ABB, GE, Alstom, CG etc. because parameter name adopted by manufacturer is different, however the procedure is same. For that you need to read the relay manual and input this data as described.

Setting Parameters for Backup Protection

  1. Directional O/C and E/F, 67/67N

Before getting started with settings for directional overcurrent and earth fault relay, let us review the operating time of different categories of IDMT relay. Generally there are three types of IDMT relay having Standard (Normally) Inverse, Extremely Inverse and Very Inverse characteristics which have different operating time.

Figure 6 IDMT

Figure 7: IDMT Relay characteristics

Since, we are using normally inverse relay for this purpose, we have adopted this relay characteristics for calculation of operating time.

Figure 8 backup

Figure 8: 67, 67N Setting Parameters

Base Current means the tapped CT ratio at primary whereas full load current means the maximum load current expected to be carried by line. The pick-up setting for overcurrent is generally set as 110% or 120% whereas for earth fault it is set as 10% or 20% of full load current.

2) Breaker Failure Protection (50BF)

Pick – up set same as earth fault protection, i.e, 0.15 x In. The breaker failure protection is set with 2 stages, one for re-trip and the other back- up trip.

The time delay is adopted based on the calculation below.

Re – Trip Time Delay (minimum) = Relay Reset Delay + CB Opening Time Delay + Margin

= 20 + 40 + 20

= 80 ms

Re – Trip Time Delay (Set)     = 100 ms

Back- Up – Trip Time Delay

(minimum)                          =  Re – Trip Time Delay + Relay Reset Delay + CB   Opening

Time Delay + Margin

= 100 + 15 + 40 + 20

= 175 ms

Back – Up – Trip Delay (Set) = 200 ms

Beside this, there are various other auxiliary protection features provided by manufacturer for line protection such as broken conductor detection, power swings, fault locator etc. the setting of which are also derived from the parameters calculated above.

Hope you have enjoyed this blog. If there are any queries regarding the content of the blog, please feel free to write me at

            -Anand Mandal (anandkalyaneee@gmail.com)

1 Comment

Filed under Uncategorized

Protection of Transmission Lines

Looking back to the history of generation of electricity, it has been widely documented that first commercial electricity generated as direct current (DC) electrical power the credit of which has been owned by Thomas Elva Edison although enough controversies still exists for ownership between Tesla and Edison. Leaving the controversies beside electrical power has been one of the greatest contributions to mankind. In current context, without electricity all the developments and life as a whole would become terrible.
The first electricity transmission systems were also direct current systems. However, due to lack of development of power electronics device and high voltage valves DC power at low voltage could not be transmitted over long distances, thus giving rise to high voltage alternating current (AC) electrical systems. Nevertheless, scenario has changed today with rapid research and development of high voltage valves HVDC transmission system is gaining more popularity day by day due to its inherent features like low transmission loss, higher power transfer capability, ease of synchronization between two independent grids, stability etc. but world still is more dependent on HVAC transmission system today due to its large network and it has served its purpose extremely well.
In this blog, we are mainly concerned with HVAC transmission system and the protection features associated with it. Since, length of electrical transmission line is long enough and exposed to outer atmosphere its protection also becomes more important to maintain power system reliability. The occurrence of fault in transmission line is much higher than that of transformer and alternator thus it requires more protection schemes. I am not discussing more on theory in this blog because we could find that everywhere in any text books and internet. Let us get started with simple protection scheme applied for 132 kV transmission line and its protection components located in substation with its features.

pic1

The above figure shows three are three transmission lines which are connected in three substations. This is just a general block diagram explaining where to incorporate the protection features of each transmission line. We can see Line 1 is connected with two substations thus protection of Line 1 is provisioned in Substation 1 and Substation 2. Similarly, the protection of line is done in the substations where it is terminated.

There are several protection schemes employed for transmission line protection. The fundamental protection scheme is discussed below:

1) Overcurrent Protection

It is common to use current magnitude to detect faults in distribution networks. Faults on the system bring about very high current levels. Overcurrent relays are the most common form of protection used to deal with excessive currents on power systems. They should not be installed purely as a means of protecting systems against overloads, which are associated with the thermal

capacity of machines or lines, since overcurrent protection is primarily intended to operate only under fault conditions. However, the relay settings selected are often a compromise in order to cope with both overload and overcurrent conditions. Based on the relay operating characteristics, they can be classified into three groups: definite current, definite time and inverse time.

2) Differential Protection

Differential protection operates when the vector difference of two or more similar electrical magnitudes exceeds a predetermined value.

pic2

In the above figure, secondaries of two CTs are interconnected, and the coil of overcurrent relay is connected across these. Under normal load conditions and fault outside protection zone of the element, secondary current will circulate between two CTs and will not flow through the overcurrent relay. But in case of fault in section between the two CTs the fault current would flow towards the short circuit point from both sides and the sum of secondary current would flow through the differential relay and if the current through the differential relay exceeds the threshold value the relay will operate.

The three main type of differential current protection are: Longitudinal differential current protection of lines comparing currents at the beginning and end of protected section, traverse differential protection of parallel lines, differential current protection of busbars.

3) Distance Protection

The distance protection relay measures the line voltage and line current at the relay location and evaluates the ratio between these quantities. We consider the relay at the station A in figure given below:

pic3

When a fault occurs on the protected line the fault current If and voltage Vf is fed into the relay. The relay should trip for faults within a fractional distance k, which is called “the reach setting ” of the distance relay, of the total distance between buses A and B. The reach given in distance unit, thus, is a tripping threshold.

The general concept of protection employed in transmission line was explained above. Now let us see the single line diagram representing the protection features employed for transmission line.

final plan_revised_working Model (1)_001

The relay symbols and numbering shown in single line diagram is according to IEC 617, IEEE C37.2-1991 and IEEE C37.2-1979. There are several auxiliary relays located inside the line control and relay panel which also serves the protection purpose of transmission line.

My next shall be briefly on distance relay protection scheme or protection of transformers.

-Anand Mandal (anandkalyaneee@gmail.com)

Leave a comment

Filed under Uncategorized

Institutions, Prevailing laws and policy in power sector of Nepal.

Institutions in Power Sector of Nepal

There is still a vertical integrated utility in Nepal. The institutions involved in power sector for its safe operation are as follows:

  1. Nepal Electricity Authority:

Nepal Electricity Authority (NEA) was created on August 16, 1985 (Bhadra 1, 2042) under the Nepal Electricity Authority Act. 1984, through the merger of the Department of Electricity of Ministry of Water Resources, Nepal Electricity Corporation to generate, transmit and distribute power by planning, constructing, operating and maintaining all generation, transmission and distribution facilities in Nepal’s power system.

Currently NEA is operating with its seven business group being accountable and responsible for generation, transmission and distribution of Nepal. They are as follows:

i. Generation Construction Business Group:

This business group is responsible for construction management including detail engineering of new projects headed by a General Manager. Currently, this business group is overseeing Chameliya HEP (30MW), Kulekhani-III HEP (32MW), Rahughat HEP (32MW) and Upper Trishuli 3A HEP (60MW).

ii. Generation Operation and Maintenance Business Group:

This business group is responsible for the optimum operation and maintenance of seventeen hydropower stations and two thermal power plants presently owned by NEA. ‘Generation of energy by optimally utilizing the resources available while undertaking periodic overhauling, major maintenance works and rehabilitation projects of the generating station’; that approximately describes the mission of G O&M Business Group.

iii. Grid Development Business Group:

This business group is responsible for development and implementation of HV transmission systems. It is headed by the General Manager and has four departments mainly, Transmission line construction department (220KV and above), Transmission line construction department (up to 132KV), Power Development project and Cross Border Transmission Line Project, each headed by the Director.

iv. Transmission and System Operation Business Group:

This business group is entrusted with the key responsibilities of generation and transmission system planning, system operation, operation and maintenance of national grid and trading of power. It is headed by the General Manager. The system planning department carries out load forecasting, generation expansion planning and transmission system planning of the power system of Nepal while System Operation Department performs the operation planning and real time system operation. Similarly, Grid operation Department carries overall operation and maintenance of national grid and Power Trade Department executes the trading of power with IPPs and also carries the business activities of power exchange and trading of power with India.

v. Distribution and Consumer Services East Business Group:

This business group is entrusted with the key responsibility of overall management of electricity distribution network of NEA in Mechi, Koshi, Sagarmatha, Janakpur, Narayani and Bagmati zones of Nepal.

vi. Distribution and Consumer Services West Business Group:

This business group is entrusted with the key responsibility of overall management of electricity distribution network of NEA lying on western territory of Nepal from Narayai River.

vii. Engineering Services Business Group:

This business group is entrusted with the responsibility to carry out engineering studies beginning from identification to detail engineering design, environmental studies, geological and geotechnical studies, headed by a General Manager.

2.Independent Power Producers (IPPs):

The annual peak power demand of the INPS in fiscal year 2011/12 is 1026.65MW, out of which contribution of IPP accounts to 102.2MW [3]. The project developed by IPPs which is under operation accounts for 187.581MW whereas project under construction being built by several IPPS accounts for 537.686MW.

3. Department of Electricity Development:

Electricity Development Center (EDC) was established on July 16, 1993 (2050 Shrawan 1) under the then Ministry of Water Resources (MOWR) to develop and promote electricity sector and to improve financial effectiveness of this sector at the national level by attracting private sector investment. It was later renamed as Department of Electricity Development (DOED) on February 7, 2000 (2056 Magh 24).

The Department is responsible for assisting the Ministry in implementation of overall government policies related to power/electricity sector. The major functions of the Department are to ensure transparency of regulatory framework, accommodate, promote and facilitate private sector’s participation in power sector by providing “One Window” service and license to power projects [4].

4. Butwal Power Company:

Butwal Power Company (BPC) is one of the leading companies in Nepal’s power sector with generation and distribution as its core business areas. Incorporated in 1966 as private company and converted into public limited company in 1993, BPC has a track record of pioneering multi faceted capacity building initiatives in hydropower development. Pursuing the privatization process, in 2003, the Government of Nepal handed over majority ownership and management control to private investors on public-private partnership model. Through its subsidiary companies, BPC is engaged in operation & maintenance of power plants, consulting engineering of hydropower and infrastructure projects, manufacturing and repair of hydro-mechanical and electro-mechanical equipment for power plants.

Prevailing laws in power sector

The principal acts existing in Nepalese power system are as follows:

  1. Hydropower Development Policy, 2001 A.D.
  2. Electricity Act, 2049.
  3. Electricity Rules, 2050.
  4. Electricity Tariff Fixation Rules, 2050.
  5. NEA Act, 2041.
  6. Nepal Electricity Regulatory Commission Act (draft).

The description of the acts and regulations defined above is given below:

  1. Hydropower Development Policy, 2001 A.D.

Availability of abundant water resources and geo-physical features provide ample opportunities for hydropower production in Nepal which aids for economic development.Total capacity of hydropower being 83,000 MW, 42,000 MW of power generation appears feasible.Hydropower developments not only contribute in speedy development of national economy but also the regional economy. Economic development, Industrialization, Flood control, Environment protection, Creation of employment opportunities in the country shall be the goal of this policy.

The objectives of this policy are as follows:

  1. Generate electricity at low cost;
  2. Provide reliable and quality electricity at a reasonable price;
  3. Combine electrification with the economic activities;
  4. Extend rural electrification; and
  5. Develop hydropower as an export commodity.

The Key policy provisions are as follows:

  1. ‘Competition’ emphasized.
  2. Priority to meet domestic demand.
  3. Encourage Build, Operate, Own and Transfer.
  4. In case of multipurpose projects, GoN may participate.
  5. Facilitate property acquisition.
  6. Transparent and rational tariff fixing mechanism.
  7. Control electricity leakages.
  8. Restructure the existing institutions.
  9. Provide reliable and qualitative electricity at reasonable price.
  10. Thrust for Storage type and multipurpose projects.
  11. Encourage micro hydro at local level.

        2. Electricity Act, 2049

It focuses to develop electric power by regulating the survey, generation, transmission and distribute the survey, generation, transmission and distribution of electricity and to standardize and safeguard the electricity services.

The key features of this Act are as follows:

  1. No person shall be entitled to conduct survey, generation, transmission or distribution of electricity without obtaining license under this Act.
  2. The term of license to be issued for the survey of electricity may be of 5 (Five) years in maximum, license to be issued for generations, transmission or distribution of electricity may be of 50 (Fifty) years in maximum.
  3. Government of Nepal may enter into agreement with the licensee for bulk purchase of electricity, guarantee for the necessary capital to be invested or other financial and technical matters.
  4. The facility of foreign exchange may be provided by GoN.
  5. There is provision for disconnection of electricity service under defined conditions.
  6. If any person desires to sell in bulk the electricity generated pursuant to this Act, Government of Nepal may purchase or cause to purchase such electricity to the national grid.
  7. If the licensee desiring to distribute electricity by importing the same within the Nepal, may do so by obtaining prior approval of Government of Nepal as prescribed.
  8. The quality of electricity supply may be defined by GoN.

       3. Electricity Rules, 2050

This rule generally defines the process to be employed for the licensing procedure of generation, transmission and distribution service within the territory of Nepal. It has also defined the procedure in order for import of electricity from foreign soil. It has also described the provision for the license fee and its renewal. It has also defined the matters to be followed by distributor and consumers of electricity. This rule has also defined the standard in order to ensure the power quality which is to be delivered to the customers. It has defined voltage level for supply systems, high voltage distribution system and high voltage transmission system as well. It has also defined the frequency allowable variation range, power factor and unit of measurement of different standard of electricity. This rule has also specified clearly the safety measures regarding electrical devices and its installations and as well as safety measures relating to electrical works. It has also described provisions relating to inspection and investigation.

      4. Electricity Tariff Fixation Rules, 2050.

Under basis of this rule, there is a formation of Electricity Tariff Fixation Commission (ETFC) which compromises of six board members. This rule has defined the procedures relating to fixation tariff and other charges, where it has been mentioned that tariff must be fixed on the basis of the rate of depreciation, reasonable profit, mode of the operation of the plant, changes in consumer’s price index, royalty and the policy adopted by Government of Nepal in relation to development of electricity etc. The marginal cost of the electricity generation, the exchange rate of convertible foreign currency, cost of the fuel to be used for the production of electricity and the financial agreement entered between the licensee and the financial institution providing loan or investing capital in the concerned electricity project shall also be taken as basis while fixing tariff in this way. It has made the provision that application must be submitted for the fixation of electricity tariff and other charges and the commission has authority to examine the application for the fixing of tariff and other charges.

       5. NEA Act, 2041

This act defines that Nepal Electricity Authority has been established for the purpose of making appropriate arrangements to supply power by generating, transmitting and distributing electricity in an efficient and reliable manner and in such a way that it is available to all. NEA Act mainly focuses on establishment of board member of NEA and its management. It has also defined function, power and authority of the Authority. It has defined the framework of general meeting and the decisions made in meeting and its implementation. It has also defined the fund and authority of NEA.

       6. Nepal Electricity Regulatory Commission Act (draft):

This Act has been proposed in 2065B.S which has set basic criteria for the formation of commission which compromises of five board members and it has also defined the qualifications regarding the appointment of board members. This act has clearly defined the work, responsibility and authority of the commission. The main features of this Act are listed below:

  1. Addressing and Managing the Technical Issues
  • To inspect the quality and safety of national transmission system.
  • To recommend GoN appropriate policy, framework for maintaining the reliable and effective generation, transmission, distribution and supply of electric service.
  • To maintain the level and framework for electricity service maintenance and operation.
  • To set the priority and condition for interruption of electricity service and defining the base for it.
  • To approve the grid code, distribution code of electricity service.
  • To investigate whether the electricity service is going on its planned way or not in order to supply the demand side.

2. Fixing of Tariff and other charges depending upon the conditions set by the Act.

3. Ensuring the competition in the power market and safeguard the rights of consumers.

4. To suggest on policy matters and recommend it to the GoN.

5. To examine and inspect the power market for the safe and competitive functioning.

6. Resolving the disputes between concerned parties.

7. Imposing fines upon the party involved in irregularities.

8. Imposing service charge upon verification and approval of several documents proposed.

9. Conducting public hearing.

10. Managing the representatives from consumer side.

11. Provision for reinvestigation.

This Act has also defined the power, responsibility and authority of the president and its members and also described the provision for fund and financial audit of the Commission.

-Anand Mandal

-anandkalyaneee@gmail.com

Leave a comment

Filed under Uncategorized

High Voltage: Introduction and Testing

INTRODUCTION

There is always a one dilemma when someone asks above what voltage level it could be termed as high voltage. Electrical transmission systems usually have a set of preferred operating voltages. The power transfer capability of transmission line also depends upon the voltage level of transmission line such that P = (V*V)/Z, where Z = surge impedance of line. For Ex: for 132KV and 220KV line power transfer capability are 43.56MW and 121MW considering Z = 400 ohms. Typical line to line ac voltage adopted around the world is 33KV, 66KV, 132KV, 220KV, 400KV, 765KV. The maximum level are 1000KV for ac and 765KV for dc line.

The rapidly increasing transmission voltage level in recent decades is a result of growing demand for electrical energy, coupled with the development of large hydroelectric power station at sites far remote from centre of industrial activity and the need to transmit the energy over long distances to the centre.

Thus, the advantages of high transmission voltage are:

  1. Reduces volume of conductor material.
  2. Increases transmission efficiency.
  3. Decreases percentage line drop.

The limitations are:

  1. High cost of Insulation.
  2. Increased cost of terminal apparatus.

For any equipment designed to operate in a power system, these voltages determine the insulation requirements such that short term degradation and breakdown is avoided. Over the long term aging of insulation may still occur at the rated voltages.

HIGH VOLTAGE TESTING

There are several preferred test that are undertaken on power system equipment to determine that their insulation is adequate. These tests have different voltage magnitudes and wave shapes, depending on what they represent.

The main characteristics of interest of insulation are the disruptive discharge which may occur during the application of stress. However, because of the randomness of the physical processes which lead to disruptive discharge, the same stress applied several times in the same condition may not always cause disruptive charge. Also, the discharge when it occurs may occur at different times. In addition, the application of the stress, even if it does not cause discharge may result in the change of insulation characteristic.

high_voltage_1The above figure is of high voltage lab at Kathmandu University, test configurations allow generation of AC voltage up to 300KV, DC voltages up to 400KV and impulse voltages up to 400KV, with different power output ratings.

Impulse Testing

The intrinsic strength of a material is its ability to withstand an impulse or transient voltage. Both lightning and switching impulses can be simulated. They have a relatively rapid rise time followed by a slower decay.

impulse testingThe waveform is described as a t1/t2 wave, where t1 refers to the rise time and t2 is the time to the 50% decay time.

Lightning Impulse

These are an act of nature and therefore the voltage is a constant magnitude as they are independent of the power system voltage level. Actual lightning impulses have voltage magnitudes of several thousand kV. The impulses are characterized by a short front and slow tail decay to zero.

The standard lightning impulse has a 1.2 μs rise time and a 50 μs decay to 50% of the peak voltage.

lightning impulseSwitching Impulses

Because these are generated by switching components of the power system, these are proportional to the rated system voltage Vrated that the component is designed for. They are due to circuit breaker operation under fault or transmission route modification. They become most important for systems with a rated voltage > 300 kV since with lightning the overvoltage factor decreases with increased rated voltage.

The standard switching impulse has a 250 μs rise time and a 2500 μs decay to 50% of the peak voltage.

Single Stage Impulse Generator

1. single stage impulse genCapacitor C1 is charged to the required dc voltage and then discharged through a circuit which shapes the impulse. This requires a breakdown of the spark gap G.

Multi Stage Impulse Generator

2. multi stage impulse genThe capacitors are charged in parallel through the high value resistors. When charged

VA = VB = VC = VD = V

VE = VF = VG = VH = VI = 0

The discharge is initiated by the breakdown of the lowest gap. When GAE breaks down, VA = 0 and VF = –V due to the charge voltage of V on CAF. But since VB = V, a voltage of 2V appears across GBF which causes that gap to breakdown. Now VB = –V, VG = -2V, etc. When all gaps have broken down a voltage -4V appears at I.

 The real picture of 14 stage impulse generator is given below:

3. 14 stage impulse gen

HVdc Supplies

 Half wave rectifier

half ave

Voltage doubler

voltage doublerCascade circuit

cascade

Over Voltage Testing

It is usual that all equipment connected to a power system is tested at a voltage at the rated frequency to determine that the equipment is unlikely to fail when connected. A one minute test at greater than rated voltage is usually specified. This is typically 2Vrated + 1 kV.

For testing a single phase of a 3 phase circuit to ground, Vrated is the line to line value. Thus an 11 kV generator will have each phase tested to 23 kV. Thus the testing voltage is about 3.6 times the rated phase voltage.

Schering Bridge Test

This provides a measurement of the loss tangent and capacitance of insulation. It is usually done near rated voltage. It compares the insulation to a negligible loss (lossless), air or gas (N2) filled standard capacitor.

4. Schering Bridge TestRX and CX represent the insulation sample (transformer, bushing, cable, etc.)

Partial Discharge Test

This measures the level of breakdown occurring in cavities within solid insulation due to erosion breakdown. It is undertaken at rated voltage.

Several discharges occur across the cavity per half cycle. The number of discharges increases with the applied voltage leading to faster breakdown of the dielectric. The cavity breakdown results in an avalanche of electrons arriving at one side of the cavity. This is a current impulse and can be detected across a resistance in series with the insulation.

5. Partial Discharge TestHVAC Testing Transformer

The basic unit is a power frequency (50 Hz) transformer. The design of this unit is similar to power transformers except that the insulation is graded for economic reasons and the windings are designed to withstand forces associated with overcurrents as a result of flashovers under test.

The basic circuit uses a voltage regulator to supply the fixed turn HV transformer.

hvac testingExperimental Circuit

hvac testing experimental

for any comments and suggestions

-Anand Mandal

-anandkalyaneee@gmail.com

Leave a comment

Filed under Uncategorized

Getting Started with Simulink: Typical A.C. Power Supply System

SIMULINK is a toolbox extension of the Matlab program. It is a program for simulating dynamic systems. Briefly, the steps of using SIMULINK involve first defining a model or mathematical representation and the parameters of your system, picking a suitable integration method, and setting up the run conditions, such as run time and initial conditions. In SIMULINK model definition is facilitated by the graphical interface and the library of templates or function blocks that are commonly used in mathematical descriptions of dynamic systems.

Simulink is one of the efficient tool for doing research or have a better understanding about engineering systems in virtual environment. It is very user friendly thus only less time is required to get used to in this platform, although the area covered by simulink is very vast and expanding day by day thus one fact also not be ignored none of them are perfect in simulink. Because user requires a great practice to get habituated with toolbox of Simulink.

In this post, I am trying to present a general overview of modeling in simulink environment of Matlab. Since I am an electrical engineer, the model which I am going to present here today is typical power system compromising of generation, tranmission and distribution. Although the friends being not familiar with power system they can go through other simple model. Facing failure and then troubleshooting it is the best way to learn in Simulink.

Before developing any model, I would suggest you to be sure about your desired requirements and initially draw a rough sketch about how the model should be organized. For typical power supply system the simple block diagram is shown below:

Simple block diagram of power supply system

                                                           Simple block diagram of power supply system

Typical a.c. power supply scheme

Typical a.c. power supply scheme

Depending upon the rough sketch, build a model in Simulink by picking the appropriate block from the library. The block made for this particular system is shown below:

  Simulink Model for a.c. power system.

Simulink Model for a.c. power system.

The generator in this model is synchronous type and is rated with 75MVA with generation voltage of 11KV, which is then step-up to 132KV by transformer and connected to bis B1. The three phase circuit breaker is placed in both sides of transmission line having length of 48km. The output parameter of generator such as electrical power, rotor angle (deg), rotor speed, terminal voltage is seem through scope. The voltage and current at bus B1 and B2 could not be connected directly to scope thus its output parameter is observed through scope via goto block. The label of goto must be similar to the label in particular bus. For ex: In bus B1, voltage is labelled as Vabc_B1 and current is labelled as Iabc_1 which is same as that of goto block from which scope is connected.

Output parameter of both of the bus

Output parameter of both of the bus

After developing the model in simulink, the next work is to input the data required by each block which could be done by double clicking in the block. For Ex: the generator and transformer block is shown below:

Generator Specification

       Generator Specification

In the above generator specification we can see the connection type, here the mechanical input is considered as speed although you may choose mechanical power as desired. The rest of the data can be updated as per your requirement. If you are trying to learn then you may work with default data also because simulink is also the best place to play with waveform.

Transformer specification

      Transformer specification


I have considered load of only 25MW for this siimulation although you may consider as per your requirement and observe the result for various analysis required.

After getting done with all of these things its time to be see the waveform and check for any errors. If you are not getting expected results or there is some error then don’t get panic, you must be happy that you are going to learn more by troubleshooting that problem.

The output from generator is shown below:

Output Parameter of generator

Output Parameter of generator

The voltage and current at bus B1 and B2 are given below:

Output from bus B1

                        Output from bus B1

Output from B2

                          Output from B2

These were only the few output shown here, although you can observe as many results as you desire by simply connecting a scope to it. If the model becomes too bigger and looks messy then it would be better to build a subsystem. It is common that you may face several problems while developing a model, but facing problem is good to learn more. MATLAB Help is better than any other book to get help from. My suggestion to beginners is that you may start with very simple model so that initially you can develop your concept in simulink, then go for a large model.

Thank You for reading this post. I hope this post would be quite helpful to you guys, although any correction and suggestions regarding this post would be highly appreciated.


-ANAND MANDAL

anandkalyaneee@gmail.com


2 Comments

Filed under Uncategorized

Getting started with GUI: Electrical Design of Transmission Line

Basic for getting started

The Graphical User Interface (GUI) is one of the most interesting features of MATLAB. Since it only compromises of programs but only gives a graphical illustration so that the user does not have to worry about the inside program and could by dealing with it graphically. GUI has a very great and wide applications in the field on engineering and all the other fields which includes mathematical computations. It is also one of the efficient tool for the programmer to display their results and works in a easy manner to all the concerned parties. In this blog, I have introduced the basic of getting started with GUI with a sample GUI program.

Before getting started with GUI here is the some basic procedure which would ease the initiation:

1)      First of all get the rough sketch of what are you doing to make. Be sure what are the input and required output of your GUI. For Ex: If you want to calculate current then set input field as Voltage and Resistance and output field as Current.

2)      After getting a rough sketch apply that on your GUI window arranging in the way you like by picking the appropriate function from GUI. For Ex: If you only want to input from your keyboard directly then use ‘Edit Text’ or if you want to select from existing then use ‘Pop-up Menu’.

3)      You can also play with colors to make it interesting and attractive.

4)      Gather mathematical equations in order to accomplish all the desired computations required for output. For Ex: In order to find current we must know that I=V/R so that we can write it in program.

5)      After doing all this, run the program and perform a sample calculation to verify your GUI. For Ex: If there 10V is applied across 2 ohm resistor we know 5A is the current, see whether the program shows the same or not otherwise check for errors.

6)      Once you as done with all of these, put a smile on your face that you have achieved your goal.

7)      Of course if you need to make it as a apps then convert it to .exe file by using MATLAB compiler by simply typing ‘deploytool’ in command prompt and follow the instructions.

Image


Fig 1: Block diagram for getting started in GUI 

Electrical Design of Transmission Line

Input Parameters

The input parameters that I have specified in this program are Length of line, Power to be evacuated, Power factor, Voltage Level and Conductor Selection. The voltage level specified for this program are 33/66/132/220/400 KV which can be chosen from pop-up menu as well as conductor could also be chosen as required. Rest of the fields are to be given as input as desired.

Output Parameters 

There are 28 output parameters, approximately all of the design parameters required for transmission line are included in this program. The mathematical equation or formula required to obtain output could be accessed from book and it could be implemented in the program.

Running the program

After entering all the input parameters the push button named as ‘Calculate‘ is to be pressed in order to see the output parameters. If you need to perform more or if you need to go for other design then press ‘Reset‘ so that all the input and output field gets to zero or null point so that we can proceed for other computations. Once you are done with this program you can press ‘Exit‘ to get out of the program or close the program.

Image


Fig 2: GUI Layout for transmission line

Programming Part

The program for this GUI is of 1497 lines thus, it is quite impossible to explain all of them. For example I am going to describe one of the part for getting ‘current at receiving end’. I have written program for all of the GUI in the callback of pushbutton ‘Calculate‘ so that by pressing a single button we can know all of the results.

The output for current at receiving end is given in polar form thus we need to find out the two results one of magnitude and other of angle. The magnitude could be find out by Ir_M=(P*1000)/(sqrt(3)*V*C) and angle could be find out by Ir_A=-((180/pi)*acos(0.9)) which is shown in the figure 3. Since the computations are being done with numbers but we are entering the inputs as a string thus before computation string is to be converted to numbers and after computations the output numbers is to be converted to string and it should be set to the respective tag of output field where the result is to be displayed.

Image


Figure 3: Programming part for current at receiving end

Design Verification

In order to verify the design I have defined two parameters: transmission line efficiency and voltage regulation. I have defined efficiency to be more than 95% and regulation is to be less than 5%. If this condition satisfies then only the dialog box appears each displaying ‘Design is successful’.

For Ex: I have given input as length of line to be 10km, power to be evacuated as 4MW, power factor of 0.9, voltage level as 11KV and conductor chosen is Weasel. The design is successful for this case. You can run programs by defining other input as well.

Image


Figure 4: Layout after running the program

I hope this blog is helpful for the GUI lovers.


-Anand Mandal

-anandkalyaneee@gmail.com

1 Comment

Filed under Uncategorized

Contingency Analysis in Power Systems

INTRODUCTION


Contingency analyses are important tasks for the safe operation of electrical energy network. Potential harmful disturbances that occur during the steady state operation of a power system are known as contingencies. Contingency analysis is carried out by using repeated load flow solutions for each of a list of potential component failures. This process has to be executed for all the possible contingencies, and repeated every time when the system load or structure changes significantly. Conventional methods are tedious and time consuming process, which is not desirable for real time applications. Various approximate methods have been proposed already for real time static security analysis of power systems. These methods reduce computational effort but they may not classify system contingencies accurately.

Image

Power Systems are operated so that overload do not occur either in real-time or under any statistically likely contingency. This is often called maintaining security. Steady state power system insecurity such as transmission lines being overloaded causes transmission elements cascade outages which may lead to complete blackout. The power system operator must know the system state at any instant. The contingency analysis is used to predict which contingencies make system violations and rank the contingencies according to their relative severity. Contingency Analysis is useful both in the network design stages and for programmed maintenance or network expansion works to detect network weaknesses. The weaknesses can be strengthened by transmission capacity increase, transformers rating increase besides circuit breakers ratings increase. The AC load flow analysis used to perform contingency analysis can be termed AC contingency analysis routine. The advantage of AC contingency analysis routine is that it provides the post outage power factor of the branch power flows besides detecting the bus voltage limit violations post contingencies. Probability of single contingencies occurrence is higher than that of multiple contingencies occurrence, but for maintenance and transmission system expansion, scheduled and planned outages may include dropping out of multiple elements. Thus it is important to study multiple outages effect as well as single outages.

Analysis of Transmission Line Outage

The formulation of corresponding bus admittance matrix is essential for simulation of transmission line outage. The outage of line tied with bus ‘m’ and ‘n’ will affect the Ymm, Ymn Ynm and Ynn element of admittance [Y] matrix. The new values of those admittances for the (π) mode of representation of transmission lines are given by equation shown below:

Image


where,

Image


Analysis of Generating Unit Outage

This approach only analyzes the outage of one unit (or more) in a generating station. Let the total generation for the station at
bus (m) be Pgm, and assume there exist identical (g) units, then power generated at bus ‘m’ after the outage is given by equation shown below:

Image


Active Power Loading Performance Index (APLPI)
APLPI is the active power loading performance index corresponding to line real power flow violations. It is formulated as shown in equation below, and gives measure of line MW overloads.

Image


Ranking of Contingencies
Generally, power system engineers use their past experiences in order to judge the system contingencies, which may be  inappropriate for analyzing severe contingencies. Therefore, the development ofa contingency ranking algorithm which would
rank contingencies based upon their relative severity is desirable.The contingencies can be ranked based upon their effects on line loading or bus voltages.

A variety of algorithms are developed which can be classified into two groups. One is the performance index (PI) based method  which utilizes a wide system scalar performance index to quantify the severity of each case by calculating their PI values and ranking them accordingly. The other is the screening method  which is based on approximate power flow solutions to eliminate those noncritical
contingencies. With the advancement of artificial intelligence, expert systems and fuzzy theory are proposed to estimate the severity of various contingencies. Also artificial neural networks approaches based on (PI) have been proposed for contingency selection. In this study contingencies are ranked using a PI based method.

The ranking method used in this paper is a fast and accurate method to rank the contingencies according to their severity on
the power system. Contingencies are ranked in the order of their performance index values and processed starting with the most severe contingency at the top of the list proceeding down the ranking to the less severe ones. The exponent (m) of the performance index is changed in the range from 2 to 30 to avoid masking errors. Outages are then ranked on the basis of their corresponding performance indices. A contingency may be severe in the point view of line loading but do not affect the system bus voltages and vice- versa.

Leave a comment

Filed under Uncategorized

Introduction to Demand Side Management: Benefits, Challenges and Barriers.

INTRODUCTION

Demand-side management (DSM) has been traditionally seen as a means of reducing peak electricity demand so that utilities can delay building further capacity. In fact, by reducing the overall load on an electricity network, DSM has various beneficial effects, including mitigating electrical system emergencies, reducing the number of blackouts and increasing system reliability. Possible benefits can also include reducing dependency on expensive imports of fuel,

reducing energy prices, and reducing harmful emissions to the environment. Finally, DSM has a major role to play in deferring high investments in generation, transmission and distribution networks. Thus DSM applied to electricity systems provides significant economic, reliability and environmental benefits. It is generally the modification of consumer’s demand of electricity through various methods such as financial incentives and consumer education. The main goal of DSM is usually to encourage the consumers to use less energy during peak hours or to move the time of energy use to the off-peak hour’s viz. night. 

There are various reasons behind for which the DSM must be promoted. Some of them are as follows:

i)           Cost reduction: many DSM and energy efficiency efforts have been introduced in the context of integrated resource planning and aimed at reducing total costs of meeting energy demand.

ii)         Environmental and social improvement: energy efficiency and DSM may be pursued to achieve environmental and/or social goals by reducing energy use leading to reduced greenhouse gas emissions.

iii)        Reliability and network issues: ameliorating and/or averting problems in the electricity network through reducing demand in ways which maintain system reliability in the immediate term and over the longer term defer the need for network augmentation.

iv)        Improved markets: short-term responses to electricity market conditions (“demand response”), particularly by reducing load during periods of high market prices caused by reduced generation or network capacity.


CONCEPTS OF DSM

The concept of demand-side management (DSM) has been introduced in the USA, more specifically in the electricity industry, in the mid-eighties. It has been originally defined as the planning, implementation and monitoring of a set of programmes and actions carried out by electric utilities to influence energy demand in order to modify electric load curves in a way which is advantageous to the utilities. Changes in load curves must decrease electric systems running costs – both production and delivery costs -, and also allow for deferring or even avoiding some investments in supply-side capacity expansion. Thus, DSM has been driven by strict economic reasons. Energy efficiency was a privileged instrument for DSM implementation, as will be seen. Hence, in societal terms, this was a typical win-win situation, as consumers would also benefit from cheaper energy services, as overall efficiency would increase.

There are six main objectives defined in the context of DSM, known as: peak clipping, valley filling, load shifting, flexible load curve, strategic conservation and strategic load growth.

In general, DSM implementation options may be classified into several different broad categories: customer education, direct customer contact, trade ally co-operation, advertising and promotion, alternative pricing, direct incentives. 


POTENTIAL OF DSM IN NEPAL

The distribution network of Nepal is very ill managed which is responsible for huge loss of power supplied by the utility. In context of Nepal, there is enormous potential of Demand Side Management. Looking towards current trend, we are only focused on generation issues but not on distribution system, although certain initiatives have been taken recently in perspective of Demand Side Management. It has been calculated has total of 150MW loss could be reduced upon implication of DSM by utility, which is a huge amount of power in case of Nepal since till now it only has total generation of 750MW roughly with maximum output in Rainy season. Most of the industry has inductive loads causing degradation of power factor eventually leading to increase in losses. Thus, industry could be motivated to use synchronous condenser at their plants which would aid in reduction of losses, otherwise utility may charge for reactive power as well.

There are large numbers of sugar mill in Nepal, which generate huge amount of electricity for their internal consumption but most of the generated energy by them are not even consumed by them. Thus, there is a large possibility of using that unconsumed amount of energy for the distribution purpose of particular locality surrounding the local mill. For Ex: there are two sugar mill in Sarlahi district generating power of about 15MW, which is not for use by them in dry season. So, this energy could be used by people of locality by bringing it to certain mechanism.

Current Status

Currently with grant from Asian Development Bank, DCS East has initiated program to distribute 750, 000 CFL lamps to improve the power factor and voltage level in some selected areas of the country. Besides, installation of capacitor banks was completed in Nepalgunj, Jaleshwor, Rajbiraj and Tanki-Sinuwari sub-stations and substantial voltage improvement has been observed. LV capacitor installation program is underway to improve voltage of the distribution networks. The goods has already been received and program is expected to complete in few months.

There are several projects being carried out in Nepal regarding demand side management. Some of them undertaken by Nepal Electricity Authority is given below:

i)        Energy Access and Efficiency Improvement Program.

ii)      Project for Energy Efficiency through Loss Reduction.

iii)    Distribution System Rehabilitation Project.

iv)    Energy Efficiency in Lightning (CFL) Project.

v)      Energy and Customer Accountability Enhancement Program.


MECHANISM FOR DSM

In order to develop mechanism, the following objectives must be identified,

i)        Identification of appropriate DSM options for Nepal.

ii)      Identification of different factors those affects the DSM options.

iii)     Identification of different stakeholders for decision making to achieve overall goals.

iv)    Addressing DSM options on the basis of priority.


There are several ways for implementing DSM. In context of Nepal, the following mechanism could be adopted,

i)     Reactive power pricing for industry: Since, most of the industries uses inductive loads in their plants which eventually consumes large amount of reactive power contributing the huge amount of power loss. Thus, reactive power pricing would help in Demand Side Management thereby reducing loss.

ii)   Installation of Capacitor banks: It would help to reduce losses at utility side also industries also must be encouraged to install capacitor banks at their industry so that reactive power needed by industry would be supplied by capacitor plants located t their own side.

iii)Promoting Energy Efficient Lamp: Energy efficient lamps such as CFL must be promoted in rural area so that people would fulfill their lightning requirement with consumption of less energy.

iv)Seasonal Tariff: It is well known that major portion of generating station in Nepal is renewable energy resources having seasonal variation of output from their plant, such as there is high generation during rainy season and less during dry season. Thus, seasonal tariff would motivate people for efficient consumption of electricity.

v)   Tariff Management: The consumption of electricity is high in peak time and less in other time. Thus, tariff should be managed in such a way that cost of energy (Rs/Kwh) is high in peak time and less in other period of day. This would encourage people to use heavy electrical appliances during off peak time.


BENEFITS, CHALLENGES AND BARRIERS FOR DSM

DSM programs offer clear benefits to stakeholders, households, enterprises, utilities, and societies. They could be summarized as follows:

Image

The concept of DSM is not new and the key technologies for its implementation have already been developed. However, the implementation of DSM has been slow because of the challenges associated with it. The challenges could listed as given below:

i)     Lack of Information, Communication and Technology infrastructure.

ii)   Lack of awareness program about DSM and its benefits.

iii)DSM based approach increases the complexity of system when compared with traditional approach.

iv)Improper market structure and lack if incentives.

v)   DSM based approach are often less competitive.

vi)Economy associated with DSM based solutions in a long run.

vii)  Rehabilitation of distribution system network is quite tedious.


The barriers for DSM are as follows:

i)        Monopoly power market structure.

ii)      No competition which leads to traditional and inefficient tariff structure.

iii)    Lack of creating awareness among consumers about the efficient use of energy.

iv)    Lack of energy efficient environment.

v)      Huge gap between supply and demand of energy.

vi)    Lack of proper incentive schemes to consumer on using energy efficient appliances and utility to implement DSM solutions.

vii)  Power system reliability, quality and stability is not able to keep itself in standard position.


-Anand Mandal

anandkalyaneee@gmail.com

4 Comments

Filed under Uncategorized