MAIN THEME
The current energy crisis in Nepal clearly indicates that the future energy-demand cannot be met by traditional energy-sources. Given the present energy scenario of the country, we may conclude that the coming years will see a transition from conventional sources to renewable sources. It will be a period to give serious thought to evolving a long-term energy strategy that will include renewable, including wind, energy and providing all legal and financial support to develop the use the zero carbon emission for our sustainable future. Thus the generation of power from renewable energy resources like Biomass, Sunlight and Water resources must have to be put on high priority to meet the future energy demand. This paper aims to highlight the potentiality of energy generation for Hydro, Solar and Biogas and urgency for development of the power generation from these resources to withstand against the future energy crisis in Nepal.
INTRODUCTION
The Federal Democratic Republic of Nepal is a landlocked country, with India to the south, east and west and the People’s Republic of China to the north. It lies between 26° 22′ to 30° 27′ N latitude and 80° 04′ to 88° 12′ E longitude, with an altitudinal range from 60 m in the south to 8,848 m in the north. Nepal encloses a total area of 147,181 km2 and a population of approximately 26,620,000. Nepal comprises three ecological bands or regions that straddle the country: the Mountain Region in the north that borders with China, Hill Region in the middle which contains valleys (in which the capital city Kathmandu is located), and the fertile Terai Region (flatland) to the south that borders with India. Approximately 53% of the population live in the Hill Region (including about 5% in Kathmandu valley) and 40% in the Terai. Around 83% of the total population lives in rural areas and the rest 17% resides in urban areas. The rural dominance in the country imply mass poverty as 38% of the population have disposable income of $1.25 a day and the average per capita income is $427 (WDI, 2011) Nepal’s gross domestic product (GDP) for 2008 was estimated at over $12 billion (adjusted to Nominal GDP), making it the 115th-largest economy in the world. Agriculture accounts for about 40% of Nepal’s GDP, services comprise 41% and industry 22%. Agriculture employs 76% of the workforce, services 18% and manufacturing/craft-based industry 6%.
Nepal is not rich in fossil fuel resources but it has plenty of renewable energy resources, in particular water that is running down from the vast Himalayan mountain ranges in over 6,000 rivers. With 300 sunny days a year, the sun’s freely available solar energy can also be converted into electricity. Nepal is presently facing an energy crisis of unprecedented proportions. The 706 MW total installed capacity of Nepal Electricity Authority, supplemented by net purchases from India, is inadequate to meet demand. Load shedding has thus become the rule of the day. In this context renewable energy development continues to be a high priority program of government as it provides a least cost solution to remote, sparsely populated areas unviable for grid extension, while being clean, safe and environmentally friendly. GoN’s goal for the next 20 years is to increase the share of renewable energy from less than 1% to 10% of the total energy supply, and to increase the access to electricity from alternative energy sources from 10% to 30% .By 2020, GoN has a plan to invest USD 1,076 million in renewable energy, of which USD 115 million will be allocated to mini, micro and pico hydro, USD 333 million for solar home systems and USD 135 million for biogas.
Present Energy Scenario of Nepal
The per capita primary energy consumption of Nepal (14 GJ) is one of the lowest in the world, just above Bangladesh. In comparison with neighboring countries, it is 52 GJ in China and 22 GJ in India. The Asian average is 26 GJ. In the context of electricity consumption, Nepal’s case is among the lowest, with just 69 kWh per capita. Three broad types of energy sources exist in Nepal: commercial, traditional and alternative energy. Commercial sources of energy include conventional fossil based, carbon intensive (coal and petroleum fuels) and electricity from large hydro plants. Traditional energy sources include biomass contents like fuel wood, biogas, agricultural by-products and animal waste used for direct combustion. Alternative energy sources include all non-conventional forms of energy such as photovoltaic, micro-hydro, wind, biofuels, geothermal, etc. The total energy consumption of the country remains primarily driven by traditional sources. Total energy consumption in Nepal in the year 2008/09 was about 9.4 million tons of oil equivalent (401 million GJ) of which some 87% was derived from traditional resources such as woody biomass and animal waste, 1% from small renewable energy sources, and only about 12% from commercial energy sources such as petroleum and fuel products and electricity from small to large hydropower plants. In the residential sector, biomass contributes about 96% of the total energy consumed. The shortages of power and frequent power outages have severely constrained the growth potential of the country. A little over half (56%) of HH in the country have access to electricity (including off-grid solutions). On the other hand, 33% of HH still depend largely on kerosene for lighting. Among five administratively defined development regions, the Western development region has the highest proportion of HH using electricity (63%), while the Mid-western development region has the lowest (34%). By ecological regions, the Mountains have the least proportion of HH that use electricity (41%). The proportion of HH using electricity in the Hills (56%) and Terai (59%) are slightly higher. As to be expected, urban areas have better access to electricity relative to rural areas (93% versus 49%).
At present, the Integrated Nepal Power System (INPS) has a total installed capacity of some 706 MW of which 652 MW (92%) is generated from hydro resources. The annual electricity generation on the grid system in 2009-2010 was about 3,690 GWh, of which about 57% was generated by power plants owned by the Nepal Electricity Authority (NEA), 26% by IPPs, and the remaining 17% was imported from the Indian grid. The power system has about 1,854,275 customers, which is an increase of 10.6% from the previous year. Table-1 shows the composition of NEA’s installed capacity.
|
Source
|
MW
|
% of Total
|
|
Major Hydro (NEA) – grid connected
|
472.99
|
67.0
|
|
Small hydro (NEA) – isolated
|
4.54
|
0.7
|
|
Total hydro (NEA)
|
477.53
|
67.7
|
|
Hydro (IPP)
|
174.53
|
24.7
|
|
Total hydro (Nepal)
|
652.06
|
92.4
|
|
Thermal (NEA)
|
53.41
|
7.6
|
|
Solar (NEA)
|
0.10
|
0.0
|
|
Total capacity including private and others
|
705.57
|
100.0
|
Table 1: Composition of NEA installed Capacity
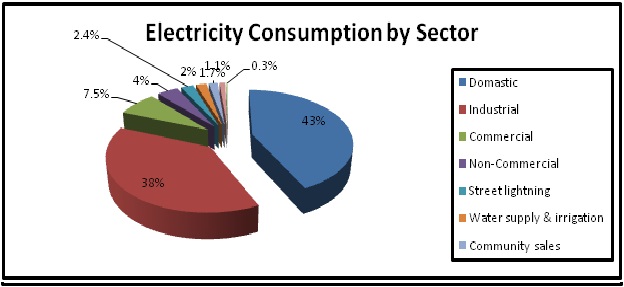
The peak load in Nepal occurs during the winter when the run-of-river power plants generate at a lower capacity (compared to the installed capacity) due to low river flows. According to the NEA, the peak demand in 2010 was 885 MW, which was an increase of 9% over the previous year. The annual energy demand was 4,367 GWh resulting in a shortfall of some 676 GWh, resulting in load shedding of 12-14 hours per day.The peak demand met by NEA rose steadily from 603 MW in 2006 to 946 MW in 2011 (with the excess over installed capacity supplemented by purchases from India), indicating a compound annual growth rate (CAGR) of 9.4%. Likewise, the total available energy increased from 2,781 GWh to 3,858 GWh at a CAGR of 6.8% during the same period. Electricity sales by NEA increased from 2,033 GWh in 2006 to 2,735 GWh in 2011at a CAGR of 6.1%. In terms of composition, the domestic sector accounted for 43% of the total consumption in 2011, followed by the industrial sector at 38%. Consumption by other sectors is very much smaller, and comprised commercial (7.5%), non-commercial (4.0%), street lighting (2.4%), water supply & irrigation (2.0%), community sales (1.7%), and bulk supply to India (1.1%), with negligible amounts consumed by transport and temples.
The energy and demand forecast for the financial years 2010-11 to 2027-28 is provided in the Table 2below. The electricity demand is forecast to reach about 3,679 MW in the financial year 2027-28, (medium growth scenario) which is an increase of some 2,800 MW from the present peak demand. The energy forecast indicates an energy output of 17,404 GWh by fiscal year (FY) 2027-28.
|
Fiscal Year
|
Energy (GWh)
|
System Peak Load (MW)
|
|
2010-11
|
4,430.70
|
967.10
|
|
2011-12
|
4,851.30
|
1,056.90
|
|
2012-13
|
5,349.60
|
1,163.20
|
|
2013-14
|
5,859.90
|
1,271.70
|
|
2014-15
|
6.403.80
|
1,387.20
|
|
2015-16
|
6,984.10
|
1,510.00
|
|
2016-17
|
7,603.70
|
1,640.80
|
|
2017-18
|
8,218.80
|
1,770.20
|
|
2018-19
|
8,870.20
|
1,906.90
|
|
2019-20
|
9,562.90
|
2,052.00
|
|
2020-21
|
10,300.10
|
2,206.00
|
|
2021-22
|
11,053.60
|
2,363.00
|
|
2022-23
|
11,929.10
|
2,545.40
|
|
2023-24
|
12,870.20
|
2,741.10
|
|
2024-25
|
13,882.40
|
2,951.10
|
|
2025-26
|
16,142.70
|
3,418.90
|
|
2027-28
|
17,403.60
|
3,679.10
|
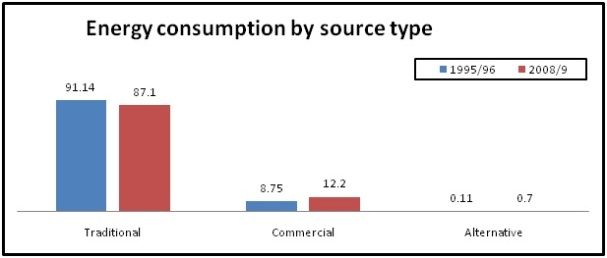
Nepal boasts snowy mountains (Himalayan range) in the North which acts as a perennial source for many free flowing rivers establishing the country second richest in water resource in the world after Brazil (Joshi and Khadka, 2009). The nation is capable of producing 42,000 MW of technically and economically viable commercial electricity from large hydro plants (EIA, 2010). However, Nepal Electricity Authority (NEA) has just managed to develop only 652.06 MW (public sector: 477.53 MW and private sector: 174.53 MW) of generation capacity including that of the Independent Power Producers (IPPs). The country, being a net importer of electricity, imports 100-150 MW of electricity annually from India. The developments of large hydropower is rather slow than anticipated. Thus, Nepal serves as a unique case of being resource rich and policy poor in terms of hydro power generation considering its potentials. Figure below shows that the energy consumption pattern by source type in 2008/09 has marginally changed as compared to 1995/1996. While fuel-wood comprised 77% of traditional energy consumption in 2008/09; marginal increment in commercial and alternative energy usage is observed in more than a decade time period. The nation remains distinctly dependent on biomass to meet the energy demand while renewable having a negligible share in total energy consumption.
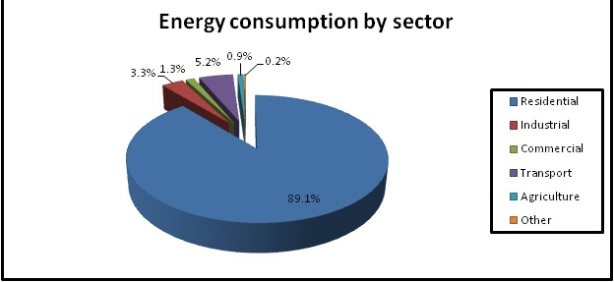
Energy consumption of traditional sources is driven by the residential sector unlike in most developed countries where the industrial sector drives the national energy consumption. In 2008/09, the residential sector in Nepal consumed 89.1% of energy contributing to major exploitation of forests and deforestation in rural areas. The transport sector consumed 5.2% of total energy which primarily includes the fossil based petroleum products. However, the lack of any oil, gas and coal reserves in the country implies that India remains the sole supplier of commercial energy sources to Nepal (WECS, 2006). Thus, a major share of export earnings is spent to import petroleum products annually and widening the bilateral trade deficit with India. Further, the irregularity in supply coupled with the rising and volatile prices of oil and gas in the international markets increases the risks of over-dependence on the imported commercial energy sources.
Around 16.5 million people currently living in Nepal are devoid of electricity and the country has an overall low score of 0.107 in terms of Human Development Index (HDI). Although, the rate of electrification increased to 43.6% in 2008 as compared to 30% in 2005; the benefits of electrification are largely confined to urban areas (IEA, 2008). Only 34% of rural population had access to electricity in 2008 as compared to 90% access for urban population during the same year. Moreover, the urban population is growing at 18% while the rural population growth rate stands at around 1.2%. Alternative energy sources based on decentralized production can play a significant role in mitigating these concerns and contribute towards sustainable development of the nation. At present, the Integrated Nepal Power System (INPS) has a total installed capacity of some 706 MW of which 652 MW (92%) is generated from hydro resources. The annual electricity generation on the grid system in 2009-2010 was about 3,690 GWh, of which about 57% was generated by power plants owned by the Nepal Electricity Authority (NEA), 26% by IPPs, and the remaining 17% was imported from the Indian grid. The power system has about 1,854,275 customers, which is an increase of 10.6% from the previous year.. According to the NEA, the peak demand in 2010 was 885 MW, which was an increase of 9% over the previous year. The annual energy demand was 4,367 GWh resulting in a shortfall of some 676 GWh, resulting in load shedding of 12-14 hours per day. The peak demand met by NEA rose steadily from 603 MW in 2006 to 946 MW in 2011 (with the excess over installed capacity supplemented by purchases from India), indicating a compound annual growth rate (CAGR) of 9.4%. Electricity sales by NEA increased from 2,033 GWh in 2006 to 2,735 GWh in 2011at a CAGR of 6.1%. In terms of composition, the domestic sector accounted for 43% of the total consumption in 2011, followed by the industrial sector at 38%. Consumption by other sectors is very much smaller, and comprised commercial (7.5%), non-commercial (4.0%), street lighting (2.4%), water supply & irrigation (2.0%), community sales (1.7%), and bulk supply to India (1.1%), with negligible amounts consumed by transport and temples.

It is estimated that Nepal has about 42,000 MW of commercially exploitable hydro power including over 100 MW of micro hydro power; 2,100 MW of solar power for the grid; and 3,000 MW of wind power. Similarly 1.1 million domestic biogas plants can be developed in the country. These assume greater significance in the context of non-availability of fossil fuel and other forms of energy in Nepal. The subsections below discuss the current status of the existing and potential renewable technologies in Nepal.
–ANAND MANDAL
E-mail: anandkalyaneee@gmail.com
References:
1) NEA Annual Reports.
2) Drafts prepared by GoN.