Introduction
The power evacuation studies for Central power plant (capacity assessed in last blog)has been done for each option available for power evacuation. The optimum voltage level is to be chosen from different alternatives available considering n-1 contingency as well in order to make the system more reliable and healthy. From the best path for power evacuation fault level is to be calculated and switch yard layout is also proposed.
Central Power Plant
The total generation capacity of this plant is 192MW peak in wet season (8 months) and 66MW peak in dry season (4 months), with annual generation of 10992.47GWh in wet season and 1871.28GWh in dry season. There are total 3 units considered for this plant where 2 units are of 70MW each and 1 unit is of size 50MW. There are four sub-stations available for power evacuation in which there is existing transmission line between each of the two sub-stations. The one-line diagram for this system is given below: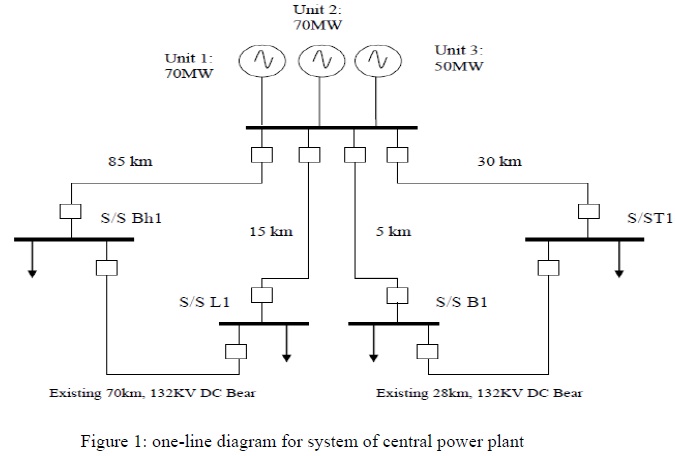
Voltage Level Selection
A transmission line transmits electrical energy in bulk from generating station to distributing station. The amount of power that has to be transmitted through transmission line is very large, if this power is transmitted at 11KV or 33KV, the line current and power loss would be large. Therefore this voltage is stepped up to higher value by using step-up transformers. The transmission voltages in Nepal are 66KV, 132KV which are in operation whereas 220KV and 400KV are still in construction phase. While selecting the transmission voltage the present and future expectable voltage of other lines in vicinity of the line under design are taken into account. Different criteria for voltages selection is given below:
First Criteria

Second Criteria
Empirical formula for voltage selection is also given by,
![]()
Where,
VL = Transmission Line voltage in KV.
L = Length of line in kms.
P = Power to be transmitted.
Nc = No. of circuits
Nc = 1(for single circuit)
Nc = 2(for single circuit)
The probable voltage level of transmission line under existing constraints is given below such as depending upon depending upon the length of line and power to be transmitted. Here, power evacuation through only one S/S in considered which seems not feasible with existing available alternatives for transmission voltage. The several schemes for power evacuation are considered below in order to choose the best alternative which must also satisfy n-1 contingency.:

Analysis
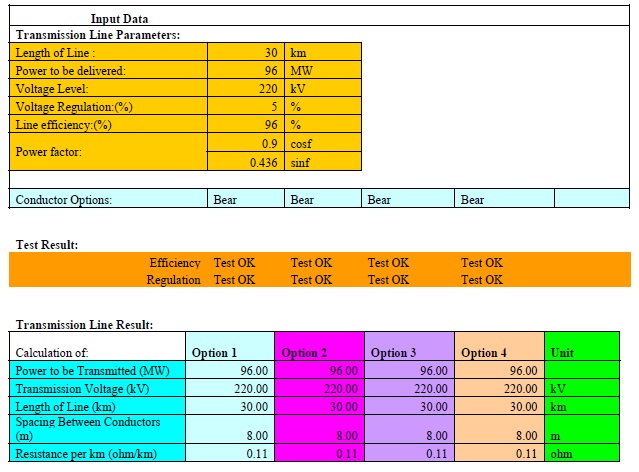
Input to the spreadsheet program are line length (km), power factor, voltage level (kV) and power (MW) to be transmitted from generation source to distribution substation. The program will carry out transmission line design analysis using selected four different conductors from a given list. The result is the outcome of technical and financial analysis. For technical analysis the program will give, voltage regulation, efficiency of line and line loss. Changing conductor size or voltage level, the result can be made within required voltage regulation and efficiency. Financial analysis is based on transmission line cost with selected conductor only. For more than
one conductor satisfying both criteria i.e. voltage regulation and efficiency the best conductor is selected for minimum KTotal.
Power Evacuation
The power generated from central power plant is 192MW whereas from central power plant it is 717MW. The power from central power plant could be evacuated through one of the S/S whereas power is to be evacuated from eastern power plant via two of the S/S.
The power from central power plant could be evacuated from S/S Bh1 having line length of 85Km through double circuit transmission line. The parameters obtained from the analysis are shown in table given below:

Fault Level Calculation
The infinite bus is considered at nearest sub-station. It is considered that three of the generators are in parallel and tied to LV bus, from where again four transformers are connected in parallel whose HV side is tied together to HV bus which is shown in Figure below.
The percentage impedance of three generators is considered to be 6%, three transformers to be 10% and transmission line be 5%

Hence,
The total impedance will be, Zt = (6/3 + 10/3 + 5/2) = 7.83Ω
Considering Base MVA 11MVA, Hence Short Circuit MVA = [(Chosen Base in MVA)*100]/(Chosen Reactance up to the point)
= (11*100)/ (7.83) = 140.48MVA
Hence Total Symmetrical short circuit current is given by
Symmetrical MVA/√3 V
= 3.68KA
Hence from the above calculation, we found the fault level of the ROR substation as 140.48MVA. Though we have given the Breaker fault level as 25KA and we got the fault current of our new design system as 3.68KA which is less than the critical value. Hence, the calculated fault level for the ROR can be recommended.
Single Line Diagram

I hope this blog would help you to proceed step by step about power evacuation from any generating station.
-Anand Mandal.
anandkalyaneee@gmail.com
